Automatic ROI placement: validation
Striatum Quant · hand atlas v1 · Toolkit v2.18. Every number below is reproduced by training/striatumHandAtlas-v1/ in the source project.
How placement works
There are no anatomy rules. The ROIs (DV, ML and MV-DL arrows and three noise boxes) are carried over from the most similar of 249 TH sections whose ROIs were placed by hand.
- The section is resampled to 80 µm per pixel and contrast-normalized; its tissue is found.
- Each library section, and its mirror image for the other hemisphere, is located by normalized cross-correlation and aligned by enhanced-correlation-coefficient registration (shift, rotation, scale), then refit over its striatum.
- The 8 best matches carry their arrows over; each arrow end is their correlation-weighted median. Four ends that sit on the striatum's edge in the hand placements (DV start, both ML ends, MV-DL end) are moved to the nearest strong edge.
- A striatum clearly paler than its partner that also matches worse (a lesion) takes the other side's arrows, mirrored.
- Noise boxes are chosen in tissue clear of both striata, at the background level the matches' hand boxes measured.
- Both hemispheres are placed; "Auto" takes the one with the lower expected error, and the other is shown faintly, one click away.
Placement accuracy
Leave-one-animal-out: each of the 249 sections was placed as a new image, with every section from its own animal removed from the library, on the hemisphere the person had quantified.
| Measure | Value |
|---|---|
| Median arrow-end distance, all sections | 137 µm (mean 181 µm) |
| Whole 10x sections (204) | 129 µm; 3.2% of ends over 500 µm |
| Sections cropped to the striata (45) | 166 µm; 10.7% of ends over 500 µm |
| Previous rule-based engine, whole sections | 373 µm; 37.1% over 500 µm |
| Noise-box background / hand noise-box background | 0.99 (IQR 0.90–1.08) |
| Arrow end | Median | 90th percentile |
|---|---|---|
| DV start | 90 µm | 201 µm |
| DV end | 190 µm | 416 µm |
| ML start | 121 µm | 494 µm |
| ML end | 137 µm | 339 µm |
| MV-DL start | 183 µm | 384 µm |
| MV-DL end | 122 µm | 313 µm |
For scale, the hand-drawn arrows are about 3.0 mm (DV), 2.1 mm (ML) and 2.7 mm (MV-DL) long. Mean error by group: crhr cKO 170 µm, crhr control 126 µm, dat cKO 211 µm, dat control 198 µm, ntsr cKO 247 µm, ntsr control 159 µm.
Effect on measurements
All 249 sections were measured at full resolution with the hand ROIs and with the held-out automatic ROIs, both at line width 2 as in Fiji, and both went through Striatum Quant's own profile analysis (noise-subtracted, 30 bins, normalized to the maximum of the mean control curve of the same strain, staining round and arrow). Re-measuring the hand ROIs reproduced the original Fiji CSVs to within 2e-05, so the comparison isolates ROI placement.
Control minus knockout, averaged over the 30 bins (bins with p < 0.05, Welch's t-test per bin):
| Strain, arrow | Control / cKO | Hand ROIs | Auto, hand hemisphere | Auto, Auto hemisphere |
|---|---|---|---|---|
| Crhr1 DV | 71 / 41 | 0.72 (30/30) | 0.74 (30/30) | 0.74 (30/30) |
| Crhr1 ML | 71 / 41 | 0.62 (30/30) | 0.72 (30/30) | 0.72 (30/30) |
| Crhr1 MV-DL | 71 / 41 | 0.72 (30/30) | 0.76 (30/30) | 0.73 (30/30) |
| Dat DV | 23 / 42 | 0.75 (30/30) | 0.72 (30/30) | 0.75 (30/30) |
| Dat ML | 23 / 42 | 0.63 (30/30) | 0.66 (30/30) | 0.67 (30/30) |
| Dat MV-DL | 23 / 42 | 0.76 (30/30) | 0.71 (30/30) | 0.72 (30/30) |
| Ntsr1 DV | 25 / 45 | 0.61 (30/30) | 0.48 (30/30) | 0.40 (30/30) |
| Ntsr1 ML | 25 / 45 | 0.38 (27/30) | 0.49 (30/30) | 0.40 (30/30) |
| Ntsr1 MV-DL | 25 / 45 | 0.69 (30/30) | 0.60 (30/30) | 0.47 (30/30) |
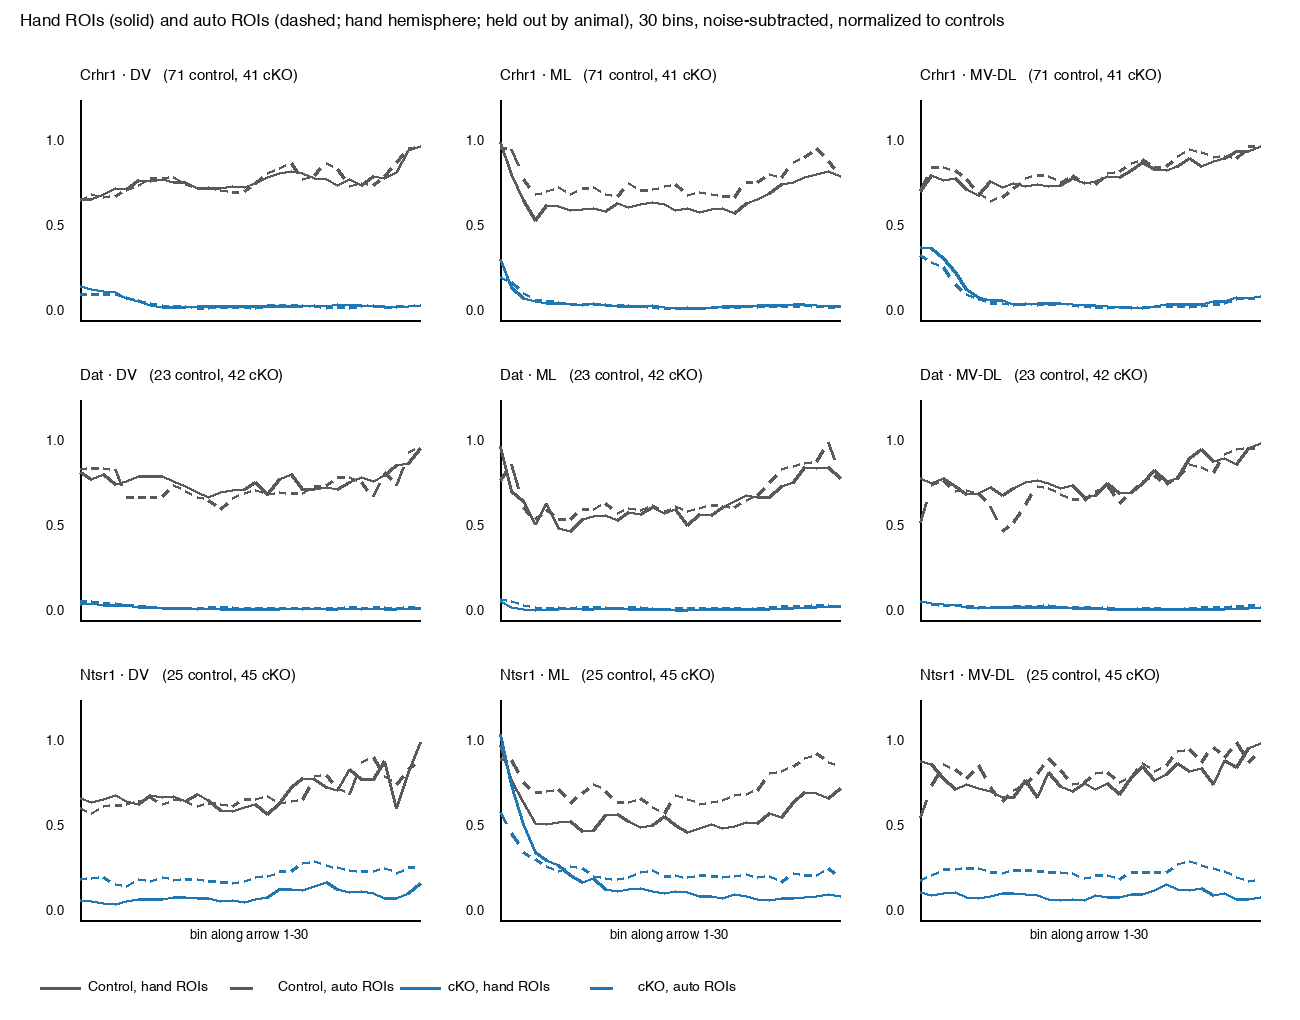
Per section and arrow, the automatic ROIs' whole-arrow mean lies a median 0.046 from the hand value (90th percentile 0.23); with the Auto hemisphere, 0.057 (0.31). The arrows and the noise boxes contribute about equally: automatic arrows with the hand boxes are within 0.024, hand arrows with the automatic boxes within 0.031. The bin-by-bin shape of a single section does not reproduce (median correlation 0.51), because moving an arrow ~140 µm crosses different TH patches; group curves average this out.
Ntsr1 differs most: its knockouts read more residual TH with automatic ROIs, because the hand noise boxes in those sections sit on brighter tissue than in any other group, which the automatic boxes do not reproduce.
Hemisphere
Which hemisphere a person quantifies could not be predicted from the image, and both striata are usually intact. "Auto" therefore takes the side whose placement is expected to be more accurate, from how well its matches fit and how far they disagree (rank correlation with the actual error 0.46). Where both striata are intact, the two sides' expected errors usually differ by a few micrometres. Auto agreed with the person's choice in 152 of 249 sections.
Sections from other laboratories
Eleven DAB-stained sections from three open-access papers (CC BY 4.0: Sci Rep 2024, Front Pharmacol 2022, Front Aging Neurosci 2026), inverted to look like fluorescence, both hemispheres each, judged by eye by the person whose placements form the library: 11 of 22 hemispheres placed properly at first, 17 of 22 after the striatum refit and mirroring, and judged ready to publish after edge snapping. A caudal section and a heavily damaged hemisphere remain known limits.
Limitations
- The library's sections are mid-striatal; at caudal levels the ventral arrow ends can run below the striatum.
- Built from far-red or CY3 TH sections of four FloxTH lines. Other stains, magnifications or heavily damaged sections may match poorly; the match level shown says so.
- Mirroring assumes a section cut close to symmetrically.
- Placement imitates one person's style. It is a starting point to review, not a measurement.
Suggested methods text
Reproducing
The source project's training/striatumHandAtlas-v1/ builds the library from the hand ROI sets and ND2 files (research data, not included) and reproduces every number here; re-run from an empty folder, it rebuilt the shipped library exactly. The model card (striatumHandAtlas-v1.card.md) and the full numbers (validation.json) ship with the site.